
Weltmeister
in numbers
meten=weten
| |
|
||||||
|
Weltmeister
in numbers |
meten=weten |
index | |||||
|
|
|
||||||||||||||||||||||||||||||||||||||||||||||||||||||||||||
Installed
capacity in MW for |
|||
installations
with EEG feed-in payments |
installations
selling electricity to market parties* |
percentage
of capacity |
|
| Hydropower | 1.340 |
22 |
1,6% |
| Wind | 25.350 |
11 |
0,04% |
| Biomass | 4.102 |
1 |
0,02% |
| Geothermal | 8 |
0 |
- |
| Gas | 641 |
1 |
0,2% |
| Photovoltaics | 9.914 |
0 |
- |
| Total | 41.355 |
35 |
0,08% |
From these numbers it is clear that there is still a long way to go to get substantial volumes of renewable electricity onto the fossil- and nuclear electricity dominated market. With respect to solar electricity (and for geothermal, still in its nascent stage), no installations have sold their yearly production to third parties in 2009.
"Selbstverbrauch"
(self-use) of solar electricity
For photovoltaics since the start of 2009 it is also possible
to "consume" the solar electricity generated on-site in Germany.
For which different (lower) rates have to be paid by the local net manager.
In those cases, an extra meter must be installed, to be able to discriminate
between the three major data measured: gross production of the PV-installation
involved, the volume of solar electricity consumed on-site, and the surplus
electricity that is not consumed directly, but that is automatically fed
into the grid. The German government has made the "self-use"
tariff for photovoltaic installations more attractive in the latest feed-in
revisions. The result of "self-use tariff" plus the electricity
tariff of the contract involved ("avoided consumption cost")
is substantially higher than in the situation that all solar electricity
is fed into the local grid.
The results for 2009 are as follows, according to BNA (page 37/table 17 of the report):
All
PV-installations |
from
which self-use |
%
share of self-use in total |
|
| Installed capacity (MWp) | 9.914 |
69 |
0,7% |
| Production (MWh) | 6.582.895* |
4.954 |
0,1% |
| EEG FIT cost (x 1.000 Euro) | 3.156.342 |
892 |
0,03% |
* Total of production fed into the grid and solar electricity consumed on-site.
Also from this table it becomes clear that the self-use option has not yet been a significant factor in the 2009 market conditions. It will be exciting to see how this "self-use option" will have evolved in 2010 and in coming years.
Sources for this update:
Pressemitteilung
Bundesnetzagentur March 21, 2011 (German)
BNA
Statistikberichte 2006-2009 (end-of-year accountant reports by BNA,
incl. pdf downloads)
BDEW statistics overview (with realisations and prognosis for further developments under the EEG regime; German)
Update November 18, 2010 - new data
Revised data for renewables development in Germany apparently were published in September on the BMU site. New installation data were given in an October 21, 2010 revision by Bundesnetzagentur (BNA), slightly adjusting data for, among others, the months October till December 2009. Latest numbers for 2009:
BNA
De cijfers voor de progressie in bij het Bundesnetzagentur aangemelde
zonnestroom capaciteit (MWp) voor 2009 (een verplichting
sinds de EEG Novelle tot geldige Wet werd op 1 januari 2009, om aanspraak
op de wettelijke invoedingstarieven te kunnen maken) werden tot en met
de maand september 2009 reeds
in oktober gepubliceerd. Deze waren nodig om vast te kunnen stellen
hoe groot de "marktgroei van het voorafgaande jaar" was geweest.
Op basis van deze vaststelling werden namelijk afhankelijk van het bereikte
"marktgroeicorridor" de degressie percentages per 1 januari
2010 vastgesteld. Zoals al lang was verwacht, werd de hoogste groei met
de vingers in de neus bereikt. Uiteindelijk volgens Photon een spectaculaire
minimaal 1.933 MWp voor het kalenderjaar
2009. BNA ging uit van de eerste 9 maanden van 2009 en de laatste drie
maanden van 2008 (wettelijk voorgeschreven), maar dat kwam feitelijk op
hetzelfde neer. Dientengevolge werden de degressiepercentages dus maximaal
opgeschoefd zoals in de EEG Novelle 2009 voorgeschreven. Zie de korte
bespreking van
1 november 2009, en natuurlijk de nieuwe grafiek
en tabel op de
EEG pagina van Polder PV.
Duidelijk al was aan die in oktober 2009 gepubliceerde eerste - nog niet gevalideerde, en mogelijk nog met de nodige "fouten" gezegende - data voor 2009, dat Duitsland alle marktgroei cijfers zou gaan verpletteren. In januari 2010 vond ik op de BNA site een separate nieuwe spreadsheet voor alleen de maand oktober 2009. Begin februari 2010 volgden de resultaten voor november 2009. En tot slot, op 9 april 2010 werden de "voorlopige" resultaten voor de laatste maand, december 2009 gepubliceerd. Elke keer waren de resultaten verbijsterend en de getallen duizelingwekkend. De voorlopige BNA cijfers claimden uiteindelijk 3.806 MWp nieuwe capaciteit, Photon publiceerde in september 2010 hun op basis van netmanager statistieken berekende bijbouw cijfer: 3.867 MWp (verschil met BNA: slechts 1,6%). Wat nogal wat "belooft" voor de cijfers voor 2010, want dat jaar gaat wederom alle records verpletteren, is de verwachting. Zie de grafieken verderop op deze pagina.
Op 21 oktober kwam BNA met enkele aangepaste tabellen voor de maanden oktober tot en met december 2009. Deze lichte revisie bracht het totaal aantal op 3.802 MWp voor 2009, wat nog steeds geen definitief getal is. Voor nieuwste data, zie tabelletje in het Engels hier boven.
BDEW
Voor een uitgebreide toelichting van de BDEW data voor de (kWh) productie
van hernieuwbare stroom, zie mijn artikel
van 11 januari 2010. De cijfers van BDEW werden gepubliceerd op 28
december 2009. Het cijfer voor 2009 moet (ook) nog worden gevalideerd
en kan nog worden bijgesteld. Heel veel veranderen zullen die cijfers
waarschijnlijk niet. Overige cijfers (eerdere jaren) zijn definitief en
afkomstig van door accountants geaccordeerde jaarrapporten. Polder PV
berekende een deel van de weergegeven cijfers uit de data in het persbericht
pdf van BDEW (Excel spreadsheet, afrondingsfouten kunnen voorkomen). En
maakte van de resultaten een serie grafieken. Zie de aparte
sectie voor de BDEW resultaten op deze pagina.
Grafieken/Graphs UPDATE: September 2010
Vergelijking van Bundesnetzagentur,
BMU, resp. Photon statistieken.
Comparison of statistics compiled by Bundesnetzagentur, BMU and Photon,
respectively
In this section a comparison is made between the data from three sources. Bundesnetzagentur published their EEG-Statistikbericht 2008 in March 2010, updating the final statistics for renewable energy up till 2008. Photon published their net manager statistics for 2009 in the September 2010 issue of the magazine, and at the same time published the spreadsheet with updated data for previous years, and preliminary data for 2009 (spreadsheet date: August 25, 2010). Finally, the Environment Ministry of Germany, BMU, published statistics with tables going back as early as the year 2000 in an extensive "Zeitreihe" spreadsheet, based on data from Arbeitsgruppe Erneuerbare Energien-Statistik (AGEE-Stat), updated July 2010. This section compiles these data for accumulated photovoltaic capacity and includes the (preliminary) data for 2009.
Accumulated capacity from different sources
 |
^^^ Purple (left columns): Older Photon net manager statistics data published in earlier updates, with correction ("Hochrechnung") for "missing data" (few net managers only). Yellow (left centre columns): Last revised Photon net manager data extracted from their August 25, 2010 spreadsheet, including revised data for the years 2006-2008, and Photon's actualisation of the 2009 numbers they acquired from 845 net managers in Germany. In blue (right centre columns), the revised data from the EEG Statistikbericht 2008 report (March 2010) published on the website of Bundesnetzagentur. In each year report, the data for earlier years are revised if need be. For 2009, the last known accumulation of 2008 has been taken by Polder PV as the basic reference. On top of that number (5.979 MWp), the preliminary 3.806 MWp of new capacity reported in detail on this webpage (accumulating month reports by BNA) has been added, bringing the (preliminary) BNA accumulation for 2009 at a level of 9,79 GWp. This is only 0,7% lower than the (preliminary) Photon estimate. Finally, in dark green (right columns), the final data of the extensive 1990 to 2009 "Zeitreihe" from BMU as of 1997. Although there are some differences with the other sources, these are small, slightly lower than the Bundesnetzagentur data in the period 2004-2007. |
Accumulated capacity per Bundesland - comparing 2008 and 2009
 |
^^^ Since the results are strikingly similar to the data from Bundesnetzagentur, Photon suggested that the "reporting policy" of PV-installation owners to BNA (obligatory as of January 1, 2009, to claim the right on the EEG feed-in tariff) seems to be working very well. And that it seems unlikely that many new PV-system owners will not have reported their installation to BNA. Photon REV = revised raw 2008 data; Photon HG = new, corrected 2009 data ("hochgerechnet" to correct for not yet available net manager data). Data © from Bundesnetzagentur and Photon reports |
Photon update Sep. 2010: "Growth as expected"
In the September issue of the ever fascinating and highly informative solar electricty magazine Photon (the German original) again a short summary has been given of the spectacular growth of the world market in photovoltaics. The new capacity growth remains staggering, as already reported in detail on this webpage (and the accompanying page with interactive graphs) showing the Bundesnetzagentur data worked out in graphic detail by Polder PV. For full details, see the original article available on the Photon website (link below).
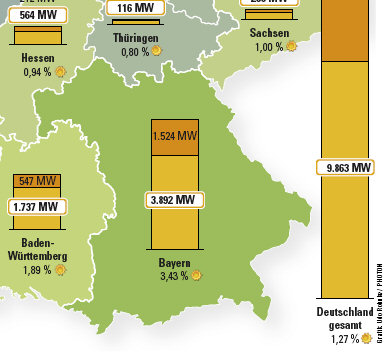 |
^^^ Note that national average already has reached a level far above one percent, in 2009: 1,27% ("Deutschland gesamt"). Total PV capacity for Germany accumulated to 9.863 MWp in 2009, 64% growth of the accumulated 2008 volume according to Photon. © Graph Ude Rohnke/PHOTON, see pdf of article (Sep. 2010). |
More details can be found in the article by Beate Knoll in Photon, and in the graphs shown by me, further below on this webpage (based on previously published monthly Bundesnetzagentur statistics). Most striking:
Links:
Bundesnetzagentur
EEG Statistikbericht (up till 2008)
Bundesnetzagentur
EEG monthly statistics (2009-2010)
"Zeitreihen"
(extensive renewable energy statistics) at BMU site Erneuerbare Energien
(up till 2009)
http://www.photon.de/photon/Zubau_2009_aus_PHOTON_2010_09.pdf
(article "Wachtstum wie erwartet" by Beate Knoll in Photon 9/2010)
http://www.photon.de/photon/photon-aktion_install-leistung.htm
(webpage on website of Photon with direct access to the spreadsheet of
PV market development in Germany)
Grafieken/Graphs UPDATE: December 2009
Note: graphs shown below have not been updated with the latest BNA revisions: they show the results from the original spreadsheets published by BNA. The differences with the most recent data are small. New capacity in 2009 in Statistikbericht BNA is 3.802 MWp, in the original spreadsheets the count was 3.806 MWp.
(1) Grafieken BNA data/Graphs made from BNA data
All
data in this section from Bundesnetzagentur (FRG).
Graphs made by Peter J. Segaar/Polder
PV, Leiden (NL).
Graph BNA 1 - Accumulation of new PV-capacity installed in monthly growth (MWp, left Y-axis, green columns) in Germany in 2009. In addition, the total accumulation for the whole year is presented in yellow columns, belonging tot the right Y-axis. Growth remains staggering and unprecedented. Year accumulation from January up till December 2009 has been 3.806 MWp. Numbers not yet definitive and probably not yet taking into account many "missing" (or twice-counted) installations in the - preliminary - BNA database...
Grafiek BNA 1 - Accumulatie van nieuw geïnstalleerde PV capaciteit in de vorm van maandelijkse groei (MWp, linker Y-as, groene kolommen) in Duitsland in 2009. Tegelijkertijd wordt de accumulatie voor het gehele jaar weergegeven in gele kolommen, data op de rechter Y-as. De groei is verbijsterend en nooit eerder vertoond. De jaar accumulatie van januari tot en met december 2009 was 3.806 MWp. Mogelijk nog niet eens de vele "missende" (maar ook mogelijk: dubbel getelde) installaties in de - voorlopige - BNA database meetellend...
CLICK on
graph for enlargement
X-axis: MWp accumulated per Bundesland in 2009.
Capacity given in number is the end of year capacity newly installed in
2009 per Bundesland.
Graph BNA 2 - Accumulation of new PV-capacity in Germany split into the contributions of the different Bundesländer (the so-called city states of Berlin, Bremen and Hamburg included). Each month has been given its own colour code. The enormous growth in the sunny 2 southern states (in particular Bavaria/Bayern - in December 1.485,2 MWp; Baden-Württemberg "only" at 550,8 MWp) is apparent. The heavily industrialized and populated Nordrhein-Westfalen state straddling the eastern part of the Netherlands follows suit (436,2 MWp). The less populated west-German state of Niedersachsen (north of NRW) is on the fourth position (346,2 MWp). Brandenburg (176,4 MWp), the only former east-German state with considerable growth relative to its much richer "western" counterparts, has an active policy for realising large free-field installations such as the 53 MWp Lieberose installation (CdTe First Solar project by juwi).
Grafiek BNA 2 - Accumulatie van nieuwe PV-capaciteit in Duitsland gesplitst in de bijdragen van de verschillende deelstaten (Bundesländer, de zogenaamde stad-staten Berlijn, Bremen en Hamburg incluis). Elke maand heeft zijn eigen kleurcode gekregen. De enorme groei van de 2 zonnige zuidelijke staten (vooral Bayern in december 1.485,2 MWp geaccumuleerd; Baden-Württemberg "slechts" 550,8 MWp) is duidelijk. De zwaar geïndustrialiseerde, dichtbevolkte, aan oost Nederland grenzende deelstaat Nordrhein-Westfalen ligt niet ver achter (436,2 MWp). De minder dicht bevolkte west-Duitse deelstaat Niedersachsen (noordelijk van NRW) ligt op de vierde plaats (346 MWp). Brandenburg (176,4 MWp), de enige voormalige oost-Duitse deelstaat met forse groei t.o.v. hun veel rijkere "westelijke" evenknieën, heeft een actieve politiek om grote vrije veld installaties te realiseren, zoals het 53 MWp Lieberose park (CdTe First Solar dunnelaag project gerealiseerd door juwi).
Graph BNA 3 - Comparable to Graph BNA 1, but this time not capacity accumulation, but number of installations reported to BNA. In green, again (left Y-axis), monthly accumulation, with a record of 42.188 new PV-systems in December 2009 only. Total number of new installations for the year 2009, yellow columns (right Y-axis), increased to a staggering 159.852 new installations at the end of the year (rounded at 160 times 1.000 in the graph). Truly the most democratic form of producing relatively predictable, reliable renewable electricity during the day in a way that is almost impossible to sabotage, reducing risks for part of the energy production. Also: stimulating a large part of the population to think about distributed energy production and local energy consumption - and of course, act upon the revolution that our society so desperately needs as their proud fellow citizens already have done.
Grafiek BNA 3 - Vergelijkbaar met grafiek BNA 1, maar ditmaal niet capaciteit accumulatie maar het aantal installaties zoals gerapporteerd aan het BNA. In groen wederom (linker Y-as), de maandelijkse accumulatie, met een record aantal van 42.188 nieuwe PV-systemen alleen al in december 2009. Het totale aantal geaccumuleerde nieuwe installaties voor heel 2009, weergegeven in gele kolommen (rechter Y-as), was aan het eind van het jaar al opgelopen tot een enorme hoeveelheid van 159.852 stuks (in de grafiek afgerond tot 160 x 1.000). Zonder meer de meest democratische vorm van de productie van relatief voorspelbare, betrouwbare hernieuwbare elektriciteit gedurende de dag op een wijze die vrijwel onmogelijk is te saboteren, daarbij risico's verminderend voor een gedeelte van de energievoorziening. Daarbij ook een groot deel van de bevolking stimulerend om na te denken over de gedistribueerde vorm van energie opwekking en lokale energie consumptie - en natuurlijk om (ook) in actie te komen middels de energie revolutie die onze samenleving zo hard nodig heeft. Zoals hun trotse, reeds PV-installaties bezittende landgenoten hebben gerealiseerd.
CLICK
on graph for enlargement
X-axis: number of new installations accumulated per Bundesland in 2009.
Numbers at the right
of the columns indicate the total number of new installations in 2009
at the end of the year per Bundesland.
Graph BNA 4 - Comparable to Graph BNA 2, but again, in this graph with the number of installations reported to BNA split up per Bundesland. The total number of installations accumulated in Bavaria (Bayern) increased to a "respectable" 57.051, only in the year 2009.
Grafiek BNA 4 - Vergelijkbaar met grafiek BNA 2, maar wederom, in dit exemplaar met het aantal installaties zoals opgegeven aan en verwerkt door het BNA opgesplitst per deelstaat. De totale hoeveelheid nieuwe installaties wat in 2009 is bijgebouwd/aangemeld bij BNA was in alleen al de deelstaat Beieren opgelopen tot een "respectabele" hoeveelheid van 57.051 PV-systemen.
Graph BNA 5A - December 2009: new number of installations per selected kWp category in blue (scale at right Y-axis), and MWp capacity cumulated in the same categories in yellow (scale at left Y-axis). Note big differences with respect to MWp distribution among installation classes as compared to the previous two months (interactive graph BNA 5B below, note: different scales for Y-axis!). The category with installations larger than 5 MWp (16 of them) already had 130 MWp, together with the category > 1 MWp 313 MWp had been installed in 112 large installations. Average installation size in the total new pool for December 2009 was 34,63 kWp (dashed yellow line, Y-axis should be read in "kWp" instead of "MWp" in that case).
Grafiek BNA 5A - December 2009: het nieuwe aantal PV-installaties per geselecteerde kWp categorie in blauw (rechter Y-as), en de gecumuleerde nieuwe MWp capaciteit per categorie in die maand in geel (linker Y-as). Let op de grote verschillen m.b.t. de verdeling van de MWp accumulaties binnen de diverse installatie categorieën, vergeleken met die van de voorgaande twee maanden (interactieve grafiek BNA 5B verder hier onder, let op: verschillende schalen voor de Y-as!). De categorie met installaties groter dan 5 MWp (16 stuks) had al 130 MWp, samen met de categorie > 1 MWp omvatten die twee grootste categorieën al 313 MWp met 112 grote installaties. De gemiddelde installatie grootte in de nieuwe december 2009 "pool" was 34,63 kWp (gele streepjeslijn, waarbij de Y-as i.p.v. "in MWp" als "in kWp" gelezen dient te worden).
 ^^^
^^^
ROLL-OVER IMAGE (move mouse pointer over graph to reveal
the previous October 2009 update)
Graph BNA 5B - In the basic graph visible I made a split of the BNA data for November 2009 only. The split is into system categories to visualize where the largest number of installations and where most MWp capacity is concentrated. The category listing is in the X-axis (in kWp/installation). Note that in the unprecedented and detailed German feed-in rate system ("Einspeise Vergütung") there are major breaks at the levels up till 30 kWp, 30 - 100 kWp, 100 kWp - 1 MWp, and bigger than 1 MWp (with free-field installations a separate tariff, see table).
At first, the graph shows clearly that the largest number of installations (blue columns, right Y-axis) typically fall into the 5 - 10 kWp range characteristic of the German private market (roof-filling PV-systems of high quality), and that there is a second maximum in the 15 - 30 kWp range. The latter is the "highest section" with the best feed-in rate per kWh (newly installed in 2009 20+ years 43,01 eurocent/kWh for all electricity fed into the lowest grid level). Many of this type of installations are designed such that they fall in the "max. 30 kWp" range, many of them are placed on farmer's barns, on school roofs, etc. Beyond that important "first barrier", the number of installations drops off sharply. Note that there is also a highly interesting - although very small - range of minute installations in Germany, with a system size of 1 kWp or less. Very little is known about this "untypical German" category of net-integrated "micro-systems". I separated this category because of the typical market conditions in my home-country, the Netherlands, where evolution of PV is extremely slow and many small systems have been - and still are being - realized.
With respect to system capacity distributed among the (artificial) installation segmentation I made (yellow columns, left Y-axis) the "weight" is, for who is adjusted to German reality, of course, shifted to the right in the graph. Here, most capacity (MWp) has been installed in the 15-30 kWp installation category (accumulated to 121 MWp in November 2009), while, in addition, there is a rather uniform further contribution over the - artificial - categories of 30-50, 50-100, and 100-1.000 kWp. The category 1.000-5.000 kWp/installation has one of the lowest impacts on total capacity installed, although 28 MWp were added by only 21 installations.
In October 2009 (move mouse pointer over the graph) there was only one installation in the highest category > 5 MWp: a 7.273,5 kWp PV-system in Doberschütz, Sachsen, included on October 27, 2009, in the BNA database. November introduced two new monsters in this category: 6,36 MWp Thiersheim in north-eastern Bavaria (near the Czech border) added on November 18, 2009. And the super parc Straßkirchen in eastern Bavaria (west of Deggendorf), included in the BNA statistics two days later on November 20 with a one-time 50,99 MWp. This parc is a typical example of a "vertical integration" strategy since it has modules made entirely of products from the former "pure solar cell player", east-German Q-Cells.
From the database I also calculated the average installation size of all November 2009 entries. It amounted to 22,41 kWp per PV-system (yellow dashed line in the graph; Y-axis should be read in "kWp" instead of "MWp" in that case). Again higher as the 20,32 kWp average of the installations in the previous month...
For december 2009 graph, see figure above.
Grafiek BNA 5 - In de basisgrafiek maak ik een opsplitsing voor uitsluitend de data voor november 2009. De splitsing betreft een herverdeling van de bij het BNA aangemelde PV-systemen over categorieën om zichtbaar te maken waar de grootste concentraties aan aantallen en totaal opgesteld vermogen zijn terug te vinden. De categorie indeling is zichtbaar onder de X-as (in kWp/installatie). Let op dat in het unieke en gedetailleerde Duitse invoedingstarief systeem ("Einspeise Vergütung") er belangrijke grenzen zijn tussen systemen tot en met 30 kWp, 30 - 100 kWp, 100 kWp - 1 MWp, en groter dan 1 MWp (met vrije veld installaties een apart tarief, zie de tabel).
Ten eerste toont de grafiek duidelijk dat het grootste aantal nieuwe installaties (blauwe kolommen, rechter Y-as) vanzelfsprekend valt in he 5 - 10 kWp traject wat karakteristiek is voor de Duitse particuliere markt (dakvullende PV-systemen van hoge kwaliteit), en dat er een tweede maximum ligt in het 15- 30 kWp traject. De laatste is het "hoogste niveau" met de beste invoedingstarieven per kWh (nieuw geïnstalleerd in 2009 20+ jaar 43,01 eurocent/kWh) voor alle stroom die op het laagste net-niveau wordt ingevoed). Veel van dit soort installaties worden zodanig ontworpen dat ze in de "maximale 30 kWp" range vallen, veel ervan geplaatst op boerenschuren, op schooldaken, etc. Voorbij deze "eerste barrière", valt het aantal installaties sterk naar beneden. Let op dat er ook een zeer interessante - ofschoon zeer kleine - categorie van minuscule installaties is in Duitsland, met een systeemgrootte van maximaal 1 kWp. Zeer weinig is er bekend van deze "ontypisch Duitse" categorie van netgekoppelde "micro-systemen". Ik heb deze categorie bewust afgesplitst vanwege de typische marktomstandigheden in Nederland, waar de evolutie van PV extreem traag blijft gaan en er zeer veel kleine systemen zijn - en nog steeds worden - geplaatst.
Met betrekking tot de systeem capaciteit die is terug te voeren op de (kunstmatige) installatie segmentatie die ik heb gemaakt (gele kolommen, linker Y-as) is het zwaartepunt voor diegenen die vertrouwd zijn met de Duitse realiteit uiteraard verschoven naar de rechterzijde van de grafiek. Hier is de meeste geïnstalleerde capaciteit (MWp) te vinden in de categorie 15-30 kWp (al 121 MWp totaal geaccumuleerd in november 2009), terwijl daar bovenop er een redelijk uniforme (hoge) verdeling is over de - kunstmatige - categorieën 30-50, 50-100, en 100-1.000 kWp. De categorie 1.000-5.000 kWp/installatie heeft een relatief geringe impact op de totale geïnstalleerde capaciteit, alhoewel er 28 MWp werd toegevoegd door slechts 21 installaties.
In oktober (beweeg muiswijzer over de grafiek) was er slechts een grotere installatie in de hoogste categorie > 5 MWp: een 7.273,5 kWp systeem in Doberschütz, Sachsen, in de BNA database opgenomen op 27 oktober 2009. November introduceerde twee nieuwe monsters in deze categorie: 6,36 MWp Thiersheim in noordoost Beieren (nabij de grens met Tsjechië) toegevoegd op 18 november 2009. En het super park Straßkirchen in oost Beieren (westelijk van Deggendorf), 2 dagen later opgenomen in de BNA statistieken op 20 november met een unieke 50,99 MWp. Die installatie is een typisch voorbeeld van een "vertikale integratie" strategie omdat het modules betreft die volledig uit producten van een nog niet zo lang geleden vrijwel "pure cellen fabrikant" betreft: het in Thalheim bij Leipzig gevestigde oost-Duitse Q-Cells.
Uit de gegevens van het BNA kon ik ook de gemiddelde installatiegrootte van alle november 2009 systemen berekenen. Het was een verbijsterende 22,41 kWp per PV-systeem (gele gestreepte lijn in de grafiek, waarbij de Y-as i.p.v. "in MWp" als "in kWp" gelezen dient te worden). Wederom hoger dan het 20,32 kWp gemiddelde van de installatiegrootte in de voorgaande maand...
Voor de december 2009 grafiek, zie de figuur hierboven.
Graph BNA 6A - December 2009 graph with new installations per Bundesland in green columns (left Y-axis), and the average installation size in red "empty" columns (right Y-axis). Big differences with the results for the previous two months, see the interactive graph BNA 6B further below (with extra explanation, note: different scale for Y-axis).
Grafiek BNA 6A - December 2009 grafiek met de nieuwe installaties per Bundesland in groene kolommen (linker Y-as), resp. de gemiddelde installatiegrootte in roodomlijnde "lege" kolommen (rechter Y-as). Grote verschillen met de voorgaande twee maanden, zie interactieve grafiek BNA 6B verderop (met verdere toelichting, let op de afwijkende schaal voor de Y-assen).
^^^
ROLL-OVER IMAGE (move mouse pointer over graph to reveal
the previous October 2009 update
Graph BNA 6B - Finally, in this last BNA graph the number of installations and the average system size is presented in a second roll-over image for the months October and November 2009, respectively (move mouse pointer to choose between the 2 graphs). Again, I made a split into the contributions for the different Bundesländer in Germany. With respect to the number of installations (green columns, left Y-axis), Bavaria and Baden-Württemberg, Germany's most southern states remain the champions with 6.851/8.146 (Oct./Nov.), and 3.527/4.080 (Oct./Nov.) new entries, respectively. However, when we look to the average system size per Bundesland (open red-lined columns, right Y-axis), a whole different "picture" emerges. In October 2009, four other "Bundesländer" take the lead. They are the city state of Bremen (44,2 kWp/installation), the East German state of Sachsen (39,3 kWp/installation), the most Northern, sunny coastal state of Schleswig-Holstein (38,6 kWp/installation), and East German Thüringen (32,8 kWp/installation), respectively. However, in November the general picture again changes dramatically, with Schleswig-Holstein taking the lead (40,5 kWp/installation!), followed by Mecklenburg-Vorpommern (38,8 kWp/installation), and that "other" city-state, Hamburg, on the third position (35,7 kWp/installation).
The average system size, of course, can be considerably influenced by a few (very) large installations in states with not too many new intallations in the period analysed. Bremen had only ten new PV-installations in October 2010 reported to BNA. The biggest of them was a 299,16 kWp system that heavily influenced the outcome for this small region (the other 9 installations had an average of only 15,9 kWp...). Hamburg had only 22 new installations reported in November 2009, but the three largest systems, 89,225, 105,74, and even 500 kWp, had a big impact on the "state's" average per system incorporated in the BNA database in that month.
It is evident that the monthly average per "Land" can fluctuate considerably, depending on the monthly growth, the number of installations newly reported, and the not too many occasions in which a (very) large PV-system is included in the monthly accumulation at BNA. Only in states with high growth in number and capacity of installations, the fluctuation of the average new system size will be much lower.
Grafiek BNA 6 - Tot slot geef ik in de laatste grafiek het aantal installaties en de gemiddelde systeemgrootte weer in een tweede "roll-over image" voor de maanden oktober resp. november 2009 (muiswijzer over het plaatje bewegen om te kiezen tussen de 2 grafieken). Wederom splitste ik de bijdrages per deelstaat in Duitsland. Met betrekking tot het aantal installaties (groene kolommen, linker Y-as) blijven Beieren en Baden-Württemberg, Duitsland's twee zuidelijkste deelstaten de kampioenen, met 6.851/8.146 (okt./nov.), resp. 3.527/4.080 (okt./nov.) nieuwe opgaves. Kijken we echter naar de gemiddelde systeemgrootte per deelstaat (open rood-omlijnde kolommen, rechter Y-as), ziet het er weer heel anders uit en gaan er in oktober 2009 vier andere deelstaten aan de leiding. Dat waren achtereenvolgens de stadstaat Bremen (44,2 kWp/installatie), de oost-Duitse deelstaat Sachsen (39,3 kWp/installatie), de meest noordelijk gelegen zonnige, aan Noord- en Oostzeekust gelegen deelstaat Schleswig-Holstein (38,6 kWp/installatie), en het oost-Duitse Thüringen (32,8 kWp/installatie). In november echter, ziet het algehele plaatje er weer heel anders uit, met Schleswig-Holstein ditmaal aan de leiding (40,5 kWp/installatie!), gevolgd door Mecklenburg-Vorpommern (38,8 kWp/installatie), en die "andere" stads-staat, Hamburg, op de derde positie (35,7 kWp/installatie).
De gemiddelde systeemgrootte kan uiteraard door slechts enkele (zeer) grote installaties in deelstaten met niet al te veel nieuwe systemen worden beïnvloed in de geanalyseerde periode. Bremen had slechts tien nieuwe PV-installaties die voor oktober 2009 bij het BNA waren aangemeld. De grootste daarvan was een 299,16 kWp installatie die zwaar zijn stempel op het eindresultaat voor deze kleine regio heeft gedrukt (de andere 9 opgegeven PV-systemen hadden een gemiddelde grootte van slechts 15,9 kWp). Hamburg had in november 2009 slechts 22 nieuwe installaties aangemeld. De drie grootste systemen, 89,225, 105,74, en zelfs 500 kWp, hadden een grote invloed op het gemiddelde van de PV-installaties in het "land" zoals die waren verwerkt in de database van het BNA.
Het is duidelijk dat het maandelijkse gemiddelde per deelstaat fors kan fluctueren, afhankelijk van de maandelijkse groei, het aantal opgegeven nieuwe systemen, en de schaarse gevallen dat een (zeer) grote PV-installatie binnen de maandelijkse accumulatie cijfers van het BNA zal gaan vallen. Alleen in staten met een hoge groei in aantallen en totaal vermogen aan installaties, zal de fluctuatie in de gemiddelde installatiegrootte binnen de perken blijven.
(2) Grafieken BDEW data/Graphs made from BDEW data
All data in this section from BDEW. Graphs made by Peter J. Segaar/Polder PV, Leiden (NL).
Graph BDEW 1 - Tota production of renewable electricity in Germany from 2004 up till 2009 in TWh/year (1 TWh = one thousand billion kWh = 1.000.000.000 kWh = 10 times 10 power 9 kWh = 10 times 10 power 12 Wh). In dark green (columns) the physical production of electricity legally claimed under the strict EEG conditions according to BDEW data. Red dashed columns illustrate the growth in production as compared to the previous year. After a record growth in the years 2006-2007 growth fell back considerably (among others resulting from the economic crisis, hence meagre new capacity realisation, leading to little growth in newly produced green kWh), but it still remained at a positive 0,4% level in 2008-2009. Average in the period 2004-2009 was a healthy 10,2% a year. The ultimate - albeit not yet validated - production in 2009 was already 93,0 TWh, the yearly production of over 23 nuclear facilities such as the old Dutch Borssele plant (yearly production app. 4 TWh).
Grafiek BDEW 1 - Totale productie van hernieuwbare elektriciteit in Duitsland van 2004 tot en met 2009 in TWh/jaar (1 TWh = 1 miljard kWh). In donkergroen (kolommen) de fysieke productie van onder het EEG vallende elektriciteit volgens BDEW. Rood gestippeld geeft de groei in productie weer t.o.v. het voorafgaande jaar. Na een record groei van 2006-2007 stortte de groei fors in (o.a. door economische crisis en dus zeer beperkte nieuwe capaciteit realisatie, leidend tot weinig groei in opgewekte nieuwe kWh), maar bleef in 2008-2009 nog steeds net positief met 0,4%. Gemiddelde over 2004-2009 was nog steeds een uitermate gezonde 10,2% per jaar. Uiteindelijke (nog te valideren) productie in 2009 was al 93,0 TWh, de jaarproductie van ruim 23 Borssele kerncentrales...
(RF = renewable
[biomass] fraction of several waste inputs)
Graph BDEW 2 - as in graph 1, but now the columns are split up in the separate shares of 5 renewable electricity generating options. Watch the strong growth of the sources solar electricity (yellow) and biomass (brown). Voor more detailed (Dutch) explanation with this graph, see the original article of January 11. 2010.
Grafiek BDEW 2 - als in grafiek 1, maar nu de kolommen opgesplitst in de afzonderlijke aandelen van 5 hernieuwbare stroom producerende opties. Let op de forse groei in de bronnen zonnestroom (geel) en biomassa (bruin). Voor uitgebreidere toelichting bij deze figuur, zie in het oorspronkelijke artikel van 11 januari 2010.
Graph BDEW 3 - comparable graph like in BDEW 2, but now with the different options split and placed alongside each other to better evaluate the ratio between the options. Solar electricity still has a relatively low impact, but it already has grown to 6 TWh/year (one time and a half the production of Dutch nuclear reactor Borssele), it is growing fast, has a lot of potential, and already in 2009 it passed the total output of production from (the biogenic fraction from) waste. Windpower has been producing slightly less by a combination of relatively low wind conditions and "repowering" because of which several older wind parks have been put out of operation and/or which will be broken down (in exchange for bigger, more powerful modern wind parks).
Grafiek BDEW 3 - vergelijkbare grafiek als 2, maar nu de deelopties naast elkaar gezet om de verhoudingen t.o.v. elkaar beter te kunnen zien. Zonnestroom heeft weliswaar nog een relatief lage impact, maar is al gegroeid naar 6 TWh/jaar (anderhalf maal productie Borssele), groeit snel, heeft zeer veel potentie, en heeft in 2009 al stroomopwekking uit (de biogene fractie uit) afval achter zich gelaten. Windstroom werd minder geproduceerd door een combinatie van relatief laag windaanbod en "repowering" waardoor veel oudere windparken tijdelijk stil liggen en/of worden afgebroken (ten bate van veel grotere, krachtiger moderne windparken).
Graph BDEW 4 - comparable diagram as in graph BDEW 3, but now the share of the production of the option considered as a percentage of total renewable production (all five options together) is presented. The most striking is (a) the considerable loss of market share of hydropower (not much structural new capacity possible [on land], and mostly already realised a long time ago, hence as other options keep growing the share of hydropower will decrease step by step). (b) the relatively high, somewhat diminished share of windpower in the sustainable mix. And (c) the gradual march ("increase of market share") of biomass and solar electricity as well. The last one already has "taken" 6,5% of the renewable electricity mix, with good growth perspective as costs for the production of PV-modules keep on going downwards, and remaining, stepwise progress in the increase of efficiency.
Grafiek BDEW 4 - als grafiek 3, maar nu wordt het aandeel van de productie van de betreffende hernieuwbare optie als percentage van de totale hernieuwbare productie (alle vijf opties bij elkaar) weergegeven. Meest opvallend is (a) de fors aan impact inboetende variant waterkracht (weinig structurele bijbouw mogelijk [op land], en al lang geleden meeste installaties geïmplementeerd, dus bij groeiend aanbod andere opties aandeel stapsgewijs, van jaar tot jaar afnemend). (b) het relatief hoge, iets afgenomen aandeel windenergie in de mix. En (c) de gestage opmars ("marktaandeel vergroting") van zowel biomassa als zonnestroom. De laatste heeft al 6,5% van de hernieuwbare mix te pakken, met vooruitzicht op flinke groei bij almaar voortgaande kostenreductie van zonnepanelen, en blijvende, stapsgewijs voortschrijdende efficiëntie vergroting.
(growth of
electricity production as related to the previous year)
Graph BDEW 5 - The relative growth of the kWh production of the separate options on a year-to-year basis. An extensive (Dutch) analysis you will again find in the article of Jan. 11 2010. Solar electricity still has good yearly growth levels, even in times of economic crisis and social turmoil.
Grafiek BDEW 5 - De relatieve groei van de kWh productie van de afzonderlijke opties van jaar tot jaar. Een uitgebreide bespreking bij deze grafiek vindt u wederom in het artikel van 11 januari 2010.
http://www.bdew.de/
... Erneuerbare_erzeugten_16_Prozent_des_Stroms?open&ccm=250010
(bron van de getallen waarvan Polder PV de BDEW grafieken
heeft gemaakt, met name van het op deze pagina ter beschikking staande
pdf document)
http://tinyurl.com/ylf2ob4
(verkorte link naar BNA bronpagina van de capaciteitsgroei
van zonnestroom in Duitsland op basis van de bij het Bundesnetzagentur
aangemelde gegevens van alle eigenaren of uitbaters van nieuwe PV-systemen
per 1 januari 2009 die beroep willen doen op de wettelijk verplichte EEG
Einspeise Vergütungen van de regionale netbeheerders. Let op: volledigheid
van database wordt door sommigen in twijfel getrokken, o.a. door Photon)
Statistiek data/statistical data:
©
Bundesverband der Energie-
und Wasserwirtschaft (BDEW)
© Bundesnetzagentur (BNA)
Uitwerking/additional calculations and graph production: Polder PV. Errors and miscalculations are the responsibility of Polder PV. Please notify the webmaster if you find any.
Webpagina
gepubliceerd dd. 11 januari 2010; toegevoegd BNA gegevens voor oktober
2009 op 17 januari 2010; toegevoegd BNA gegevens voor november 2009 op
4 februari 2010; toegevoegd BNA data voor december 2009 op 10 april 2010;
added (English): Photon, Bundesnetzagentur, and BMU statistics and graphs,
Sep. 9, 2010.
|