
Europe
going solar
| |
|
||||||
|
Europe
going solar |
index | ||||||
|
|
|
||||
 |
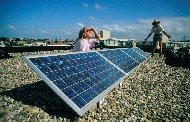
^^^ The "brownfield" conversion site has been cleaned before building the power plant. It was commissioned by the renewables branch of nuclear power major EDF. A 36 MWp portion, "Toul 2", acquired by Marguerite Fund (several European banks as well as the European Commission participating), has been cofinanced by Dutch sustainable banks ASN and the Belgium branch of Dutch Triodos (financial details here). A 24 MWp section was sold to independent power producer Sonnedix. ©
Hors-Série le journal du photovoltaïque N° 9–
2013. |
* Note: In this article, the decimal separator used is the "comma". Hence, the English "1.4 million" is written as "1,4 million", and half of a percent ("0.5%") is given as "0,5%".
Summary/Samenvatting
On this webpage I present graphs that I made from the data published by
EurObserv'ER in their last Photovoltaic Barometer report (April 2013),
and previous versions. According to these figures, EU27 market in 2012
grew with 16,5 GWp to an accumulated photovoltaic installation capacity
of 68,6 GWp. In 2012, with that volume, over 68 terawatthours of clean
electricity might have been produced.
Op deze pagina presenteer ik grafieken die ik heb gemaakt van data gepubliceerd door EurObserv'ER in respectievelijk hun laatste Photovoltaic Barometer rapport (april 2013) en uit eerder gepubliceerde documenten. Volgens deze data/figuren is de EU27 markt in 2012 gegroeid met 16,5 GWp nieuw PV-vermogen, waarmee een geaccumuleerd volume van 68,6 GWp werd bereikt. In 2012 zou met dat volume meer dan 68 terawattuur kunnen zijn opgewekt.
* 2012 Preliminary results/voorlopige resultaten. With respect to the preceding years, the last available data from previous reports have been taken as "final" results (according to EurObserv'ER statistics, for some countries some minor corrections have been implemented a year after the first publication of those results). EurObserv'ER provides "fast-access" data to be able to track market volume growth as soon as possible. Data may differ with other resources (such as EPIA, IEA), depending in part of the definition of "installed" capacity.
Capacities shown are in DC generator capacity, hence the STC value of the PV-modules in the solar installations. Internationally known as "Wp" ("Wattpeak"). Inverter (AC) capacity is not considered here. Hence, for an important market such as Flanders, for which only total MWac capacity is known (data by VREG), this fundamental difference should always be kept in mind.
Introduction
to this webpage (July 14, 2011, Dutch)
Previous reports:
up till 2010, up
till 2009, up till 2008
Introductie
In april 2013 werd een nieuw overzicht van statistieken over zonnestroom in de EU27 gepubliceerd door EurObserv'ER. Polder PV maakte wederom, net als voor vorige rapportages van deze instantie, grafieken van de belangrijkste cijfers voor de marktontwikkeling bij PV en kleinschalige thermische systemen, en belichtte nog enkele opvallende zaken. Gezien de internationale context, is, na de volgende paragraaf, de rest van dit artikel geschreven in het Engels.
In de EurObserv'ER rapportages worden de cijfers voor Nederland aangeleverd door ECN Beleidsstudies. Aangezien het zo lang duurt voordat er überhaupt voorlopige cijfers van CBS "los" komen (eerste resultaten voor 2012 pas op zijn vroegst eind mei 2013 verwacht), is dat in het verleden met grove schattingen gepaard gegaan. En ging er wel eens iets mis met de eerste opgaves (zie opmerkingen over het rapport voor 2010).
Eind maart 2013 werd aan enkele partijen in de PV-markt, waaronder Polder PV, door ECN Beleidsstudies (partner bij het EurObserv'ER statistiek project) gevraagd wat hun inschattingen waren voor de afzet in 2012. Begin april werd mijn "hoge schatting" uit mijn artikel van 9 juli 2012 door ECN Beleidsstudies overgenomen. Ik had toen een traject ingeschat tussen de 145 en 175 MWp. Met als "niet onmogelijk" potentieel een uitloop in de richting van 200 MWp. Dat was nadat de eerste ruwe CBS cijfers voor 2011 bekend waren geworden, die later fors omhoog werden bijgesteld op basis van mijn aan het CBS gestuurde leveranciers-lijsten. ECN nam mijn "hoge 175 MWp" nieuwbouw waarde als "potentiële groei" voor 2012 over, zoals uit het inmiddels gepubliceerde rapport blijkt (formuleringen** zijn uiteraard niet van mijn hand):
^^^
Screendump van pagina 65 van het EurObserv'ER rapport.
en
^^^
Screendump van pagina 75 (laatste) van het EurObserv'ER rapport.
Op basis van mijn inbreng, en een berekening door ECN Beleidsstudies zelf, zijn de volgende data voor Nederland opgenomen door EurObserv'ER:
Nieuwbouw 2011-2012
Linker 3 kolommen: nieuwbouw 2011 (laatst beschikbare cijfers), 58 MWp netgekoppeld, 0,0 MWp autonoom, totaal 58 MWp nieuwbouw. Zijn afgeronde cijfers, CBS (20 december 2013) meldde: 58,473 MWp, waarvan slechts 86 kWp autonome systemen zou hebben betroffen (zeer slecht bekend marktsegment).
Rechter 3 kolommen prognose voor 2012 (overname van mijn "hoog" scenario" door ECN): 175 MWp nieuwbouw, autonoom 0,0 (onbekend, is bij meeste landen opgaves ook zo), totaal 175 MWp.
Eindejaars-accumulatie 2011-2012
Linker 3 kolommen: eindejaars-accumulatie 2011 (laatst beschikbare cijfers). Daar wordt gemeld dat er 141 MWp netgekoppeld en 5 MWp autonoom zou hebben gestaan, opgeteld tot 146 MWp. CBS meldde echter al veel eerder in hun StatLine databank dat er 59 MWp netgekoppeld nieuw zou zijn bijgekomen, en 1 MWp (op basis van verondersteld "15 jaar levensduur"!) "uit gebruik genomen" zou zijn. Wat het eindejaars-volume (puur theoretisch!) op 145 MWp zou brengen (zie meest recente overzicht StatLine, status 8 februari 2013).
Rechter 3 kolommen de prognose voor 2012. Gebaseerd op mijn "hoge" voorspelling jaargroei 175 MWp, wat in dit plaatje werd opgeteld bij de (1 MWp te hoog geschatte) eindejaarsaccumulatie 2011, resulterend in 321 MWp totaal. ECN is daarbij uitgegaan van een stabiel blijvend volume van 5 MWp autonoom, wat zou inhouden dat voor netgekoppeld 316 MWp zou resteren eind van 2012.
Vermeende stroom productie 2011-2012
Ook is de op basis van de opgestelde capaciteit (door ECN) berekende jaarlijkse zonnestroomproductie voor alle landen weergegeven door EurObserv'ER:
Links de hoeveelheid die Nederland "verondersteld zou hebben geproduceerd" in 2011, rechts het volume voor 2012 op basis van de in bovenstaande tekst weergegeven "eindejaars-capaciteiten", in GWh. Nederland zou in een jaar tijd de productie van zonnestroom - ook al is het nog slechts een peuleschil - hebben verdubbeld tot 200 GWh. Dat is nog steeds een fractie van het totale stroomverbruik (119 TWh volgens StatLine), en wel 0,17%. En het wordt niet gemeten, maar met verouderde kengetallen afgeschat (zie commentaar Polder PV).
Uiteraard, zoals zo vaak met statistieken, kunnen deze cijfers nog beslist worden bijgesteld als meer harde gegevens beschikbaar komen.
** Zo zou ik voorzichtig zijn met het "hard" stellen van het bereikt hebben van "net-pariteit" ("grid-parity") in Nederland, omdat de variabele kWh prijs in ons land in extreme mate wordt gedomineerd door belastingen, zoals ik gedetailleerd heb gedocumenteerd. Die hebben natuurlijk helemaal NIETS te maken met de werkelijke "waarde" van de fossiel-gedomineerde stroommix die in het net wordt gepompt. Ik zou daarom liever spreken over het bereikt hebben van "energie-belasting-pariteit" ("energy-tax-parity"). Mocht de Staat om een of andere reden het hele heffingen stelsel van energiebelastingen grondig gaan wijzigen, kan dat hele "grid-parity" verhaal als een kaartenhuis in elkaar gaan vallen...
Grafieken
met marktontwikkeling zonnestroom in EU27
Graphs with market development for photovoltaics in EU27
Figure 1. Note - all figure updates based on April 2013 report (Photovoltaic Barometer EurObserv'ER).
Accumulated capacity of photovoltaic installations in the EU27, in GWp (1 GWp = 1.000 MWp = 1.000.000 kWp), in eight consecutive years (2005-2012*) according to the latest data reported by EurObserv'ER. Data are from the last and previous Photovoltaic Barometer reports. Data for 2012 (asterisk) are preliminary and will change as new/adjusted market data will become available.
The graph shows strong growth in the years shown, and an overwhelming dominance of grid-connected systems. Autonomous ("off-grid") systems make up only 0,24% of the EU27 PV market in 2012 (that used to be 4,7% in 2005 and 0,9% in 2009) and will dwindle even further in significance as the on-grid market grows with huge new volumes each year. Growth has been even negative between 2006 and 2007 for this small off-grid category. Growth in grid-connected PV has been strong in that period (over 59%), almost doubled to 113 percent from the accumulated 2007 capacity into 2008, and grew a considerable 58% in the economic "crisis" year 2009. Going into 2010, the market grew another extreme 84%, 2011 showed 75% increase, and, finally, might have given a further 32% boost in another crisis year, 2012 (with market data now available). Accumulated capacity in EU27 amounted to 16,3 GWp in 2009, and an impressive 68,6 GWp in 2012. Over four times larger, and 47% of which would have accumulated in Germany alone (over 32 GWp end of year accumulation 2012). Corrections of these data will probably follow in the next photovoltaic barometer report or the Barobilan inventory by EurObserv'ER.
CLICK
on graph for enlargement
Figure 2. New photovoltaic capacity per country and per year, in MWp (2006-2012). Order, from left to right, is related to the end-of-year accumulated market volumes per country for 2012 (note: preliminary data, see Fig. 3). Only numbers for 2012 are shown for clarity. If "0,000 MWp" has been given by EurObserv'ER, no data are shown in the figure. From this graph - note, with logarithmic Y-axis - it becomes clear that there are huge differences in market development in EU27 countries, and that fast growing markets develop in different time frames. In addition: such highly lucrative markets might dwindle in a short time if political backing of exceptionally succesfull incentive regimes collapses (e.g. Spain after its 2008 "boom year").
CLICK on graph for enlargement
Figure 3. Accumulated PV-capacity per EU27 country for the years 2005-2012 (only for 2012* accumulation is given in numbers for clarity). Sorting order is for accumulated capacity end of 2012, according to the latest EurObserv'ER data (left to right). Note absolute dominance of world market Germany, with almost 33 GWp accumulated, end of 2012 (in February of 2010, the 10 GWp milestone has been reached). For the year 2012 another - preliminary - world record increase (difference between green and dark-grey column, over 7,6 GWp in one year) is apparent for Germany. Spain, only one year (2008) worlds' biggest market for new installations, has completely collapsed in 2009 due to severe capping of the new capacity allowed under the FIT regime, regressive limitations to the amount of kWh's subsidized under previous (extremely lucrative) feed-in Law-conditions, accompanying regulatory bureaucracy, much lower feed-in tariffs for new installations, and a land in turmoil with several economic crisis situations. Data for 2010-2011 show a reasonable growth rate of 371-379 MWp, but growth has again slowed down in 2012 (only 194 MWp).
Italy catapulted itself into comfortable second position behind Germany, with app. half that volume, and a more than respectable growth of 3,6 GWp in 2012. However, due to budget constraints, that market will cool off considerably in 2013.
|
