|
|
                    
Solar
statistics Europe 2009*
Zonne-statistieken
Europa 2009*
On
this webpage I present graphs that I made from the data published
by EurObserv'ER in their Photovoltaic Barometer report (April 2010),
the Solar Thermal Barometer report (May 2010), and data presented
in earlier reports on these renewable energy markets. In addition,
in March 2011 EurObserv'ER published their 10th State of Renewable
Energies in
Europe report, with new data for a few countries only. For two graphs
for PV development updates have been included (marked in the legends).
Further updates will follow as the new Photovoltaic Barometer will
be published and time can be found to adjust the spreadsheets and graphs.
For a verbose summary of mentioned report, with graphs, see the article
of March 4, 2011 (Dutch).
Op
deze pagina presenteer ik grafieken die ik heb gemaakt van data
gepubliceerd door
EurObserv'ER in respectievelijk hun Photovoltaic Barometer rapport
(april 2010) en hun Solar Thermal Barometer rapport (mei 2010), en
van eerder gepubliceerde data over deze hernieuwbare energie markten.
In maart 2011 publiceerde EurObserv'ER hun 10e "status van hernieuwbare
energie in Europa" rapport, met nieuwe data voor slechts enkele
landen. Ik heb deze data verwerkt voor PV en op deze pagina twee grafieken
ververst (gemarkeerd in legenda). Verdere updates zullen volgen zodra
het nieuwe PV-Barometer rapport beschikbaar zal komen. Voor een uitgebreide
bespreking van genoemd rapport, zie het artikel
van 4 maart 2011.
* 2009
Preliminary results/voorlopige
resultaten. With respect to the
preceding years, the last available data from previous reports have
been taken as "final" results (according to EurObserv'ER statistics,
for some countries some minor corrections have been implemented a
year after the first publication of those results). EurObserv'ER
provides "fast-access" data to be able to track market
volume growth as soon as possible.
Capacities
shown are in DC generator capacity, hence the STC value of the PV-modules
in the solar installations. Internationally known as "Wp" ("Wattpeak").
Inverter (AC) capacity is not considered here.
Changes
with respect to Photovoltaic Barometer report May 2010
Market
development for photovoltaics in EU27 GRAPHS
Market development for thermal
solar collectors in EU27 GRAPHS
Links
Previous
report (up till 2008)
Previous
and more recent reports:
up till 2010, up
till 2008
Summary 10th
Renewable Energies report EurObserv'ER here (March
4, 2011)
Introductie
In april
2010 werd een nieuw overzicht van statistieken over zonnestroom
in de EU27 gepubliceerd door EurObserv'ER. In mei 2010 volgde het rapport
over thermische zonne-energie (zonnecollector markt) in de EU27. Polder
PV maakte wederom, net als voor het vorige
rapport over met name 2008,
grafieken
van de belangrijkste cijfers, en belichtte nog enkele opvallende zaken.
Voor twee grafieken (PV) werd gebruik gemaakt van data gepubliceerd
begin maart 2011.
Veranderingen Photovoltaik Barometer rapport 2009 en 10th State of
Renewable Energies rapport 2009
Changes between Photovoltaik Barometer rapport 2009 and 10th State of
Renewable Energies rapport 2009
^^^
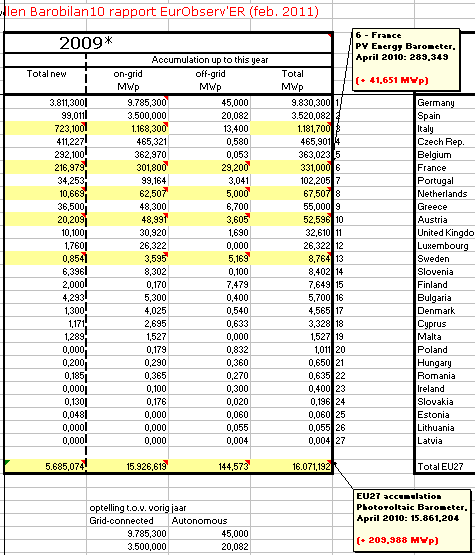
Screendump van spreadsheet van de EurObserv'ER rapporten wat Polder PV heeft
gemaakt.
Gedeelte van de nieuwe gegevens voor zonnestroom markt in EU27 in 2009.
Yellow
fields: changed data. Most particular France (+ 42 MWp), Italy
(+ 149 MWp) and Austria (+ 15 MWp). All changes together have lead
to 210 MWp extra capacity for EU27, as compared to the previous Photovoltaic
Barometer Report published May 2010.
Grafieken met marktontwikkeling zonnestroom in EU27
Graphs with market development for photovoltaics in EU27
Figure
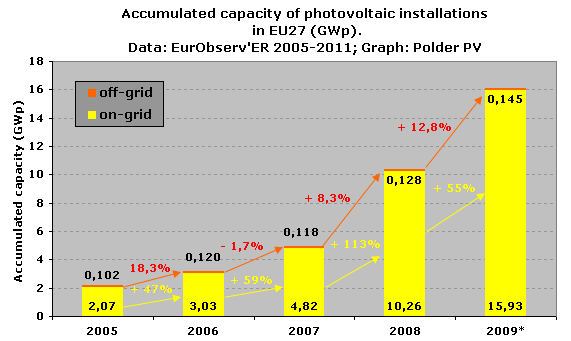
1. Update: March 2011 (10th
State of Renewable Energies in Europe report).
Accumulated
capacity of photovoltaic installations in the EU27, in GWp (1 GWp
= 1.000
MWp
= 1.000.000
kWp), in five
consecutive years (2005-2009) according to the latest data
reported by EurObserv'ER (note that numbers might have been refreshed
in new reports
dealing with previous years,
the latest data available in these reports have been included here).
Data are from the last and previous Photovoltaic Barometer reports.
The
graph shows strong growth in these years, and an overwhelming dominance
of grid-connected systems. Autonomous ("off-grid") systems
make up only 0,9% of the PV market in 2009 and will dwindle even further
in significance as the on-grid market grows with huge new volumes
each year. Growth has been even negative between 2006 and 2007 for
this small off-grid category. Growth
in grid-connected PV was strong in that period (over 59%), almost
doubled to 113 percent from the accumulated 2007 capacity into 2008,
and even grew considerably 55% in the economic "crisis" year
2009. Final accumulated capacity in EU27 amounted to 15,93 GWp in
2009
(according
to updated EurObserv'ER's (but still preliminary) data for that year,
corrections will probably follow in the next photovoltaic barometer
report).
Figure
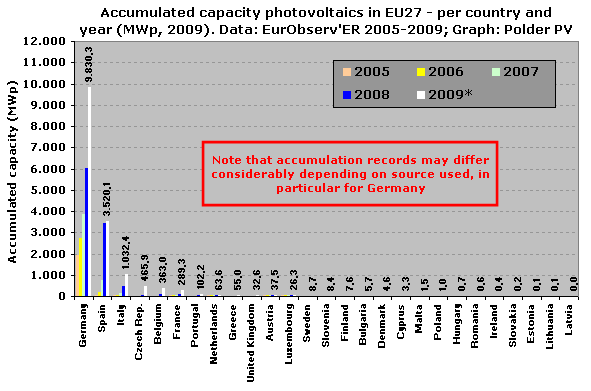
2. Accumulated PV-capacity per EU27 country (only
for 2009 accumulation is given in numbers for clarity). Note absolute
dominance of world market Germany,
with over 9,8 GWp accumulated, end of 2009 (in February of 2010,
the 10 GWp milestone has
been reached). Secondly, for the year 2009
a world record increase
(difference between white and blue column, over 3,8 GWp in one
year) for the German world market. Thereby again taking over the
first position, as Spain, only one year worlds' biggest market for
new installations in the previous year, has completely
collapsed due to severe capping of the new capacity allowed
under the FIT regime, accompanying regulatory bureaucracy,
lower
feed-in
tariffs,
and
a land in turmoil with several economic crisis situations.
Italy on
a good
third place with already over 1 GWp in accumulation, and increasing
new capacities coming on-line. The rest of the EU27 countries
is hardly visible on this scale (see graphs below for detail). Only
the surprising Czech Republic and even more astonishing Belgium did
very
well considering
their relative size and populations. For some markets, actual accumulation
data can differ considerably, depending
on the source and the status of the statistical reviews.
Therefore, mind the
red warning (also applicable to other graphs presented on this page).
Note
that for France, the results for the overseas departments ("Departements
Outre Mer", DOM) also have been included in the accumulated
data by EurObserv'ER. For the dominant grid-connected market segment
they account for a respectable accumulated total of 67,5 MWp in 2009,
representing
25% of the 268,2 MWp connected to the grid in the
whole country including DOM. This
should be kept in mind if one wants to consider the European
context
focussed
on
the old subcontinent and its neigbouring isles. The "DOM" isles,
French Guyana, and a small slice of Antarctica, all falling under
a variety
of administrative legislation frameworks, are scattered over the
globe and far removed from the direct "physical" influence
sphere of Europe, see English Wikipedia map
and accompanying clarifications.
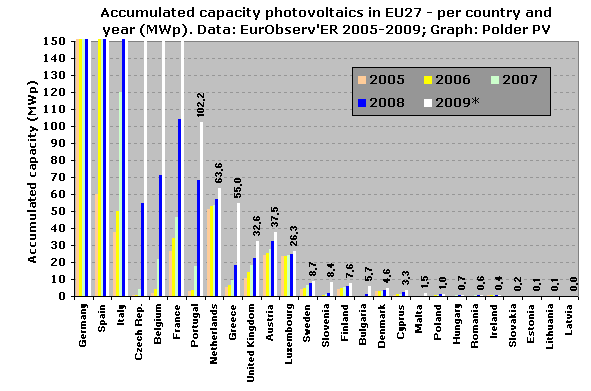
Figure
3. Same graph as figure 2, but with a scale better
outlining the data for the rest of the EU27 countries (Germany up
to France running off the Y-axis for 2009, see Figure 2). Note the
strong differences in development between the other countries: explosive
to good growth
in the Czech republic, Belgium,
France, and Portugal (good, uncapped incentive
regimes). But low
growth for my own country, the Netherlands. That once was on the
forefront
of
market
implementation,
but that
has
lost
all contact with reality with an extremely complicated, highly capped,
and hardly stimulating "incentive" regime as of April 1,
2008 (example: 17.000 applications for "small category" in
2010 on first day, only 4.200 approved; 35.000 applications for "large
category" in
2010 on first day, expected only app. 150 (!!!) to be approved because
of marginal budget...).
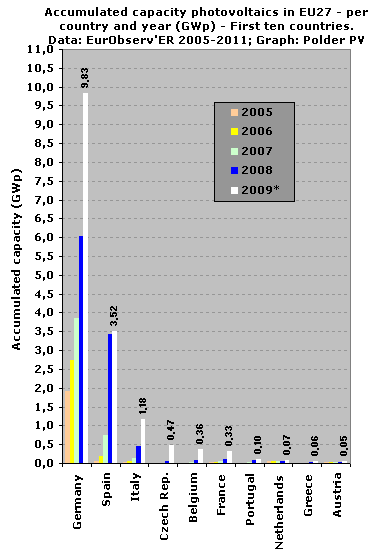
Figure
4. Update: March 2011 (10th State
of Renewable Energies in Europe report).
Detail
showing the first 10 countries in the EU27 with respect to PV capacity
accumulation, showing huge variation in the implemented
PV-capacities (accumulated volume numbers shown for 2009 only). Difference
between World Champion Germany and
(in update:) Austria has become a staggering factor 197
in 2009. Difference with Spain has shrunk dramatically
from a factor 32
in 2005 to only 2,8 in 2009. However, this is expected to grow
again, as Germany already installed 6 GWp in the first 11 months
of 2010, and the Spanish market
is still struggling
from the post 2008 collapse, showing only marginal growth since then
(with more troubles looming ahead). In the "top
ten",
the Netherlands and Greece markets hardly grew significantly, only Austria
seemed to have started a small mini-boom (passing UK for the time being
with respect to accumulated capacity). It is expected, however, that
in particular the UK market will get a
boost from its implemented
new, and well-balanced feed-in regime (it added 33,3 MWp under Ofgem's
microgeneration scheme in 2010, data to be published by Polder PV). With
the imminent hard-core crisis
conditions
in Greece it remains to
be seen
how much
of its long-year
potential of 3 GWp waiting in the bureaucrat's pipeline will see the
grid on short
notice...
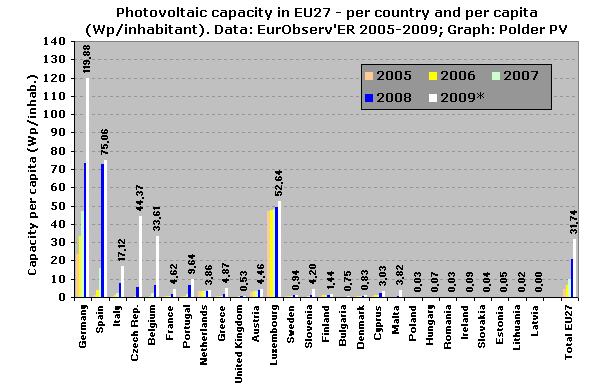
Figure
5. Accumulation of PV-capacity in EU27 countries
per inhabitant/capita and per year. For this, the World Population
Reference Bureau data
for 2009 have been used in the calculations by Polder PV (hence:
mid 2009 population as fixed reference). Numbers shown for 2009 only,
for other years refer to the scale of the Y-axis. A very different
picture emerges, with the small
country Luxembourg as a suprising third on the podium, behind Germany
and Spain. However: incentives have been stopped
there, and growth as of 2005 has been low. In contrast, the
ratios in other countries have been growing fast. Not only in the
world market Germany. Also Italy, the Czech republic and Belgium
are developing fast (as of 2011 the perspective for Czech republic
is however not good, if net manager problems are not solved).
France - with its relative big population - still does not have a
notable impact in this graph but will probably grow faster
in
coming
years
(2010
included).
Portugal is positioned relatively high with its not too large
population (10,6 million) but already
102,2 MWp of PV-installations (high impact of large field installations)
according to EurObserv'ER. In the right of the graph, the average data
for EU27 countries have been given. Already
almost 32 Watt(peak)
per capita has been realized in the EU27 in 2009, almost 4 times
less on average than world champion Germany has reached in that year
by itself.
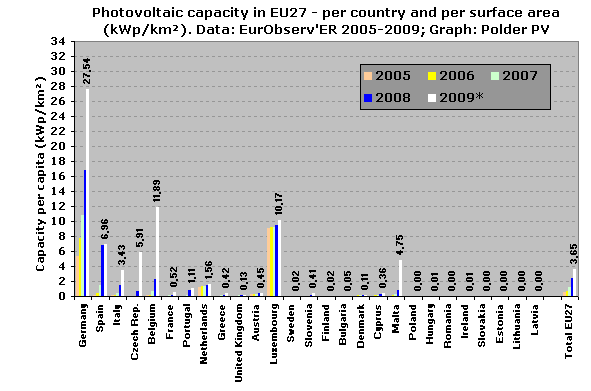
Figure
6. Graph comparable to Figure 5, but this time the (land)
surface area of the countries has been taken as reference for total PV
capacity installed (in kWp of PV installed per square km. of land). Again,
World Population Reference Bureau data have been used, published in their
2006
report. Yet
another
picture
emerges (numbers shown for 2009 only).
Related to surface available, Germany again taking the lead with almost
28 kWp per square kilometre of land available in 2009. But surprisingly,
rapidly growing Belgium has taken the second position with almost 12 kWp/km²,
just before neighbouring Luxembourg. The next candidates are close together:
Spain, Czech Republic, and the Mediterranean island state Malta, with Italy
trailing further behind. Netherlands is taking the lead in the back-row,
but its new capacity is only growing sluggishly. Most (small) installations
have been realized already in its heigh-day in 2003... Average EU27 realisation
in 2009 is 3,65 kWp per square km. of land surface.

Figure
7. Rating of ten best countries with respect to
accumulated (total) PV capacity in 5 consecutive years (2009 left, 2005
right, screendump
op Excel spreadsheet). Germany and Spain leading the way from the beginning,
although the latter's second
position in 2009 could be threatened in a few years time by surging Italy.
Netherlands (marked yellow), once "the brave PV country bordering
the North Sea", has
given
all its cards
away and is gradually sinking from its respected third position in 2005
(due to a small market boom with (far to) hefty installation subsidies
in 2003) to an
extremely
bitter 8th position in 2009. With little perspective that things
will turn out to become better since its new "incentive" regime
(SDE as of April 1, 2008) has turned out to be a totally unstimulating
and heavily
capped bureaucrat's nightmare full of investment uncertainties.
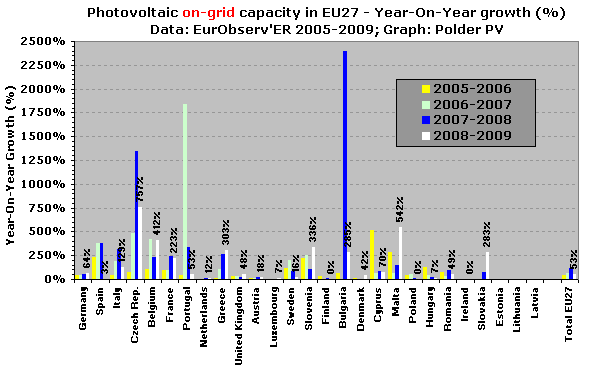
Figure
8. Year-on-year growth of the on-grid photovoltaic
markets in EU27 countries for the period 2006 to 2009, in percentage
of the
previous market accumulation year published by EurObserv'ER. Actual
percentages
only
presented for
the period
2008-2009 for all countries.
Yet another
picture emerging. In world market Germany
growth has been a good 64% in one of the deepest economic crisis
years in modern human history. Czech Republic showed absurd growth
of 757% (not considered "sustainable growth"
in that
country). Other remarkable growth percentages in Malta (plus 542%),
Belgium (plus 412%), Greece (plus 303%), Slovakia (plus 283%) and
France (plus 223%). Of course, when
a market
is
still
small the
growth percentages will be very high (e.g., Portugal in 2006-2007,
Bulgaria in 2007-2008). That is the reason that the growth in the
already huge, mature world
market
Germany "seems" so
modest in this
comparison. Spain has been a tear jerker in 2009 (plus 3%) and its
growth perspectives are dark because of constant troubles related
to the 2008 boom, added to other structural problems (overcapacity
in electricity generation).
Again,
my own rich country the Netherlands, once a "top" market
for a few years, is behaving as a very bad boy in this comparison,
with low growth percentages (12% in 2008-2009, lower than growth
in Sweden in Northern Europe, only minor help from the new "incentive"
regime).To the right of the graph
again
the average data
for all EU27 countries is presented. Showing "healthy"
growth
percentages of 96% for the period 2007-2008, and, suprisingly,
a considerable 53% in the "crisis period" 2008-2009.
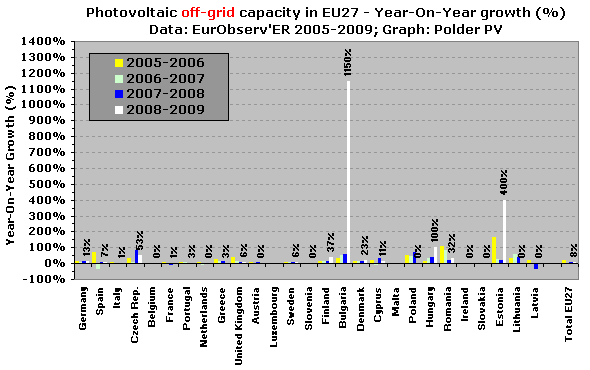
Figure
9. Same as for Figure 8, but now for the off-grid PV-systems
in Europe. Remarkable growth in Bulgaria (plus 1.150%) and Estonia (plus
400%) in 2008-2009, but considering their still nascent markets these high
percentages should be taken with precaution. All-over growth rates in most
countries remain low, a few percent per year at the most, with further
exceptions Hungary (doubling of off-grid market), Czech Republic and Finland.
In Latvia apparently older off-grid installations have been scrapped from
the records. Note that "decommissioning" policy in EU 27 states
is mostly paperwork instead of real-time monitoring, and the guidelines
for this
tricky interpretation
differ between states, if they even exist. EU 27 showed growth of 8% on
average in the period 2008-2009.
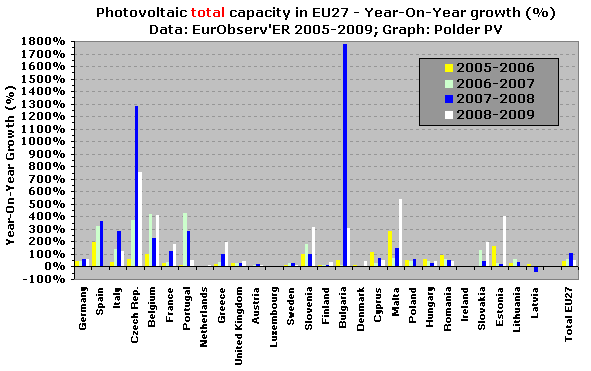
Figure
10. Graph comparable to Figs. 8 and 9, but now all PV-installations
(on-grid and off-grid) are shown in one graph. Some countries showed overall
growth of a few hundred percent in 2008-2009 (Czech Republic, Malta, Belgium,
Estonia and Slovenia). In reality, only Czech Republic and Belgium should
be considered as "serious PV markets". This, however, can change
in the future, strongly dependent on active policies to break the existing
energy
oligopolies, and to give maximum room for decentralized electricity generation.
General EU 27 growth amounted to 53% in the period 2008-2009 (all PV installations).
Grafieken
met marktontwikkeling van thermische zonnecollectoren in EU27
Graphs with market development for thermal solar collectors in
EU27
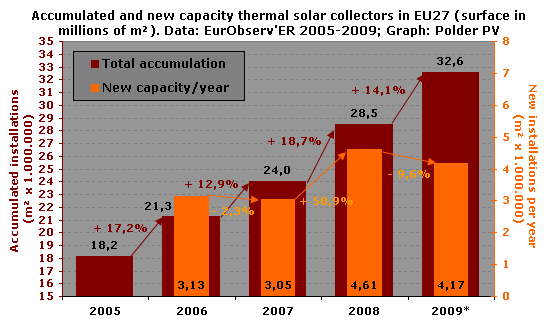
Figure
11. Thermal solar collector market development in
EU27 in the years 2005-2009. Newly added surface (m²) per year
stagnated from 2006 to 2007 (slight decrease in new capacity added),
grew again strongly
with almost 51% (added: over 4,6 million m²) in
2008, but regrettably dropped again 9,6% in growth into the crisis
year 2009 (orange columns, right Y-axis). Total accumulation of all
m² installed
in
EU27 grew, however
strongly,
17,2%, 12,9%, 18,7% and still a good 14,1% in the years 2006-2009
(dark brown columns in
the
background,
left
Y-axis).
Already,
a surface
of 32,6
million square metres had been realized at the end of 2008 in the
27 EU countries, good for 2.916 MW of thermal power (MWth). This
specific solar market seems to be more sensitive to political and
economic factors than the more "sexy" PV market. The (temporary???)
withdrawal from a good incentive in world market Germany in
2009 does not
help
to let this very important market segment flourish as it should.
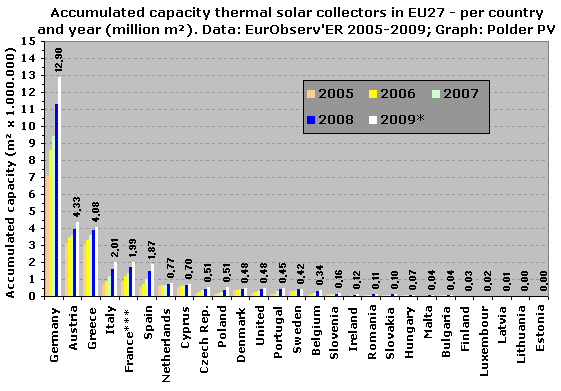
Figure
12. Surface area (in million square meters) of thermal
solar collectors in 27 EU countries. Again, Germany leads the way
in unprecedented
manner
(almost
3 times
as much surface area as the number 2), followed bij their southern,
also German-speaking neighbour Austria that has
a
long tradition with this particular sustainable energy modus. Thermal
collectors can be found on many roofs in the Mediterranean region,
which is
reflected in the data from EurObserv'ER: Greece leading the way and
not far behind from Austria. Followed by Italy that has surpassed
France, and Spain at a slightly smaller level. Surprisingly, Netherlands
follows on number 7 (just ahead of Cyprus), but development of the
market again remains relatively
slow, despite the introduction of a new temporary incentive regime.
Only for 2009 the accumulated
data
are
given per country. Growth in Germany has been considerable in economic
crisis year 2009 (added: 1,62 million m², only slightly less
than in the previous year).
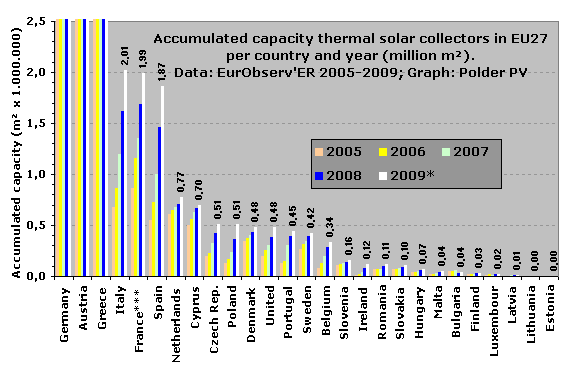
Figure
13. More detailed graph as Figure 12, better outlining
the contributions of the "lesser" countries (Germany to
Greece off-scale). Note that, apart from these first three countries,
also strong growth occurred in Italy, France and Spain (France including
DOM's).
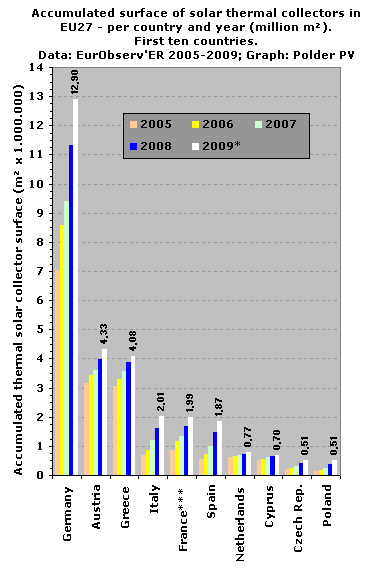
Figure
14. Detail showing the first 10 countries in the
EU27, with a considerable range of implemented thermal solar collector
surface
areas. The difference between Germany and
Poland (somewhat surprising number 10) has grown to a factor 25
in 2008 - the "span" between the numbers 1 and 10 is much
less wide than with photovoltaics (see Figure 3). The difference
with the number 2, Austria,
remains,
however
considerable - a factor of almost 3 in 2009.
Growth has been moderate in most countries. Italy and Spain
grew at a somewhat faster pace.
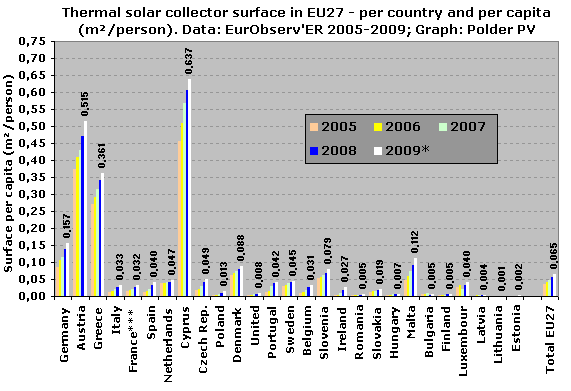
Figure
15. Accumulation of thermal solar collector capacity
in EU27 countries in m² collector surface per inhabitant/capita and
per year. Also for this graph, the World
Population Reference
Bureau data
for 2009 have been used in the calculations (hence: mid 2009 population
as fixed reference). And also in this picture, some other accents
become visible as in the original graphs with "absolute" surface
areas per country. This time, the small, sunny Mediterranean island
of Cyprus leads the way, with
a surface
of 0,637
m² per inhabitant.
Germany, leader when it comes to overall surface area realized, is
set back to the fourth place with "only" 0,157 m²/pp. because of
its large population (hence: smaller
ratio
per inhabitant).
Austria
is
on the
second
position (0,515 m²/pp.), followed by the only other serious competitor
Greece (0,361 m²/pp.). Following Germany other countries mostly
have less than 0,1 square metre
per inhabitant, with the exception of that other Mediterranean
island, Malta, with 0,112 m²/pp. At the right end of the graph,
the average data
for EU27 countries have been given: 0,065 m² per
capita has been realized in the EU27 in 2009, which easily should
and could get much larger. Thermal solar energy can offset a lot
of fossil primary energy use and should be stimulated with great
urgency.
A
similar graph can be made with the ratio MWth/capita, but this is
almost identical with the graph presented here.
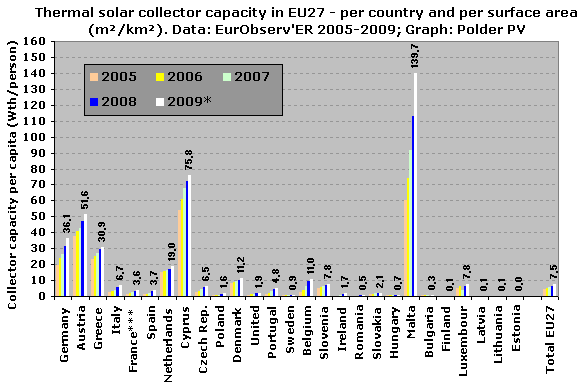
Figure
16. Graph comparable to that shown in Figure 15, but this
time the total collector surface area accumulated is related to one square
kilometre of land available in the country shown. Again, World
Population Reference
Bureau data
for 2006 have been used for the calculation of that ratio. This time not
Cyprus, but the much smaller Mediterranean island state of Malta is the
best performer, with an impressive 139,7 m² of collector surface per square
km. of land area. Cyprus is a good second (75,8), this time followed by
Austria
(51,6),
Germany (36,1), and Greece (30,9 m²/km²). The relatively small Netherlands
scores well in the next league, with 19,0 m²/km². Average EU27 score is
7,5 m² per square kilometre of land in 2009.

Figure
17. Rating of ten best countries with respect to accumulated
(total) solar thermal capacity (in m²) in 5 consecutive years (2009
left, 2005 right, screendump op Excel spreadsheet). Comparable with Figure
7
for PV installations. Germany, Austria and Greece leading the
way from
the beginning,
and probably unchallenged for years to come. France (including DOM, preliminary
results) was pushed downwards by upcoming Italy in 2009 in the EurObserv'ER
update. Czech Republic and Poland as surprising newcomers. Netherlands
(yellow fields) has remained stable for years in this rating, after taking
one step back from 2005 to 2006 due to rapidly developing Spain. It remains
to be seen if the present seventh position can be kept in our troublesome
country.
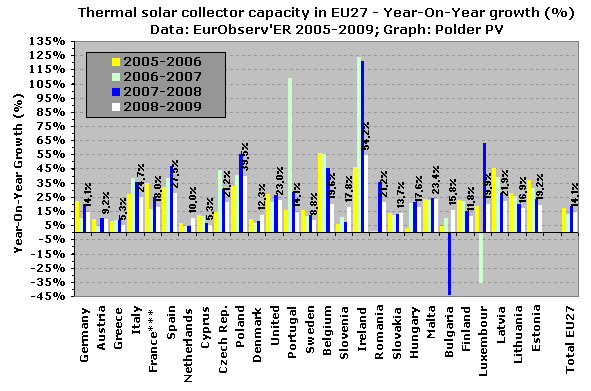
Figure
18. Year-on-year growth of the thermal solar collector
markets in EU27 countries for the years 2006 to 2009, in percentage
of the previous market
accumulation
year published by EurObserv'ER. Actual percentages only presented
for the period 2008-2009 for all countries.
Yet
another picture emerging, with relatively "low" growth
in world market Germany (slightly over 14% in the period 2008-2009),
and suprising strong growth for the Atlantic island nation of Ireland
(54,2% in
2009). Other growth percentages are good (despite deep economic crisis
conditions) and widely spread among EU27 nations. Portugal had a
short boom year in 2007
and fell
back
to a more moderate 29% growth in 2008 and even 14% in 2009. Poor "growth
performers" in relative sense are Cyprus, Greece and Sweden. Netherlands
slightly increased its pace, with 10% growth in 2009 (note that its southern
neighbour Belgium had almost double that growth rate). The
minute state
of
Luxembourg (part of the Benelux to which Netherlands and
Belgium
also belong)
had
a peculiar
negative
correction
(?) of
its installed capacity growth in the period 2006-2007, but started
growing again considerably in 2008 (possibly new correction of installation
numbers?) and 2009. Also Bulgaria showed a strong negative correction,
in 2008. Average European (EU27) growth numbers for these two years were
18,7 and 14,1%,
respectively.
Links
http://www.eurobserv-er.org/ (homepage
of EurObserv'ER)
http://www.eurobserv-er.org/pdf/barobilan10.pdf (The
State of Renewable Energies in Europe - 10th EurObserv'ER Report -
2011; 203 pages, 10,3 MB)
http://www.eurobserv-er.org/pdf/baro196.asp (Photovoltaic
Barometer, April 2010, originally published in SYSTÈMES SOLAIRES
le journal du photovoltaïque N° 3 – 2010; 23 pages,
3,54 MB)
http://www.eurobserv-er.org/pdf/baro197.asp (Solar
Thermal Barometer, May 2010, originally published in SYSTÈMES SOLAIRES
le journal des énergies renouvelables N° 197 – 2010; 22
pages, 1,8 MB)
http://www.prb.org/Publications/Datasheets.aspx (data
sheets on world population and (2006 version) surface area by country)
Further
reading:
http://www.epia.org/ (European
PhotoVoltaic Industry Association, EPIA. See publication list here,
including the Annual Report 2009, pdf, 3 MB, and the latest market
outlook up till 2014, pdf,
2,45 MB)
http://www.estif.org/ (European
Solar Thermal Industry Federation, ESTIF. See also report Solar Thermal
Market in Europe. Trends and Market Statistics 2009 [June 2010], pdf 8,34
MB)
Pagina gepubliceerd
op 23 juni 2010; partiële updates (gemarkeerde grafieken) 4 maart 2011.
|
